Built-In Business
Intelligence Tools
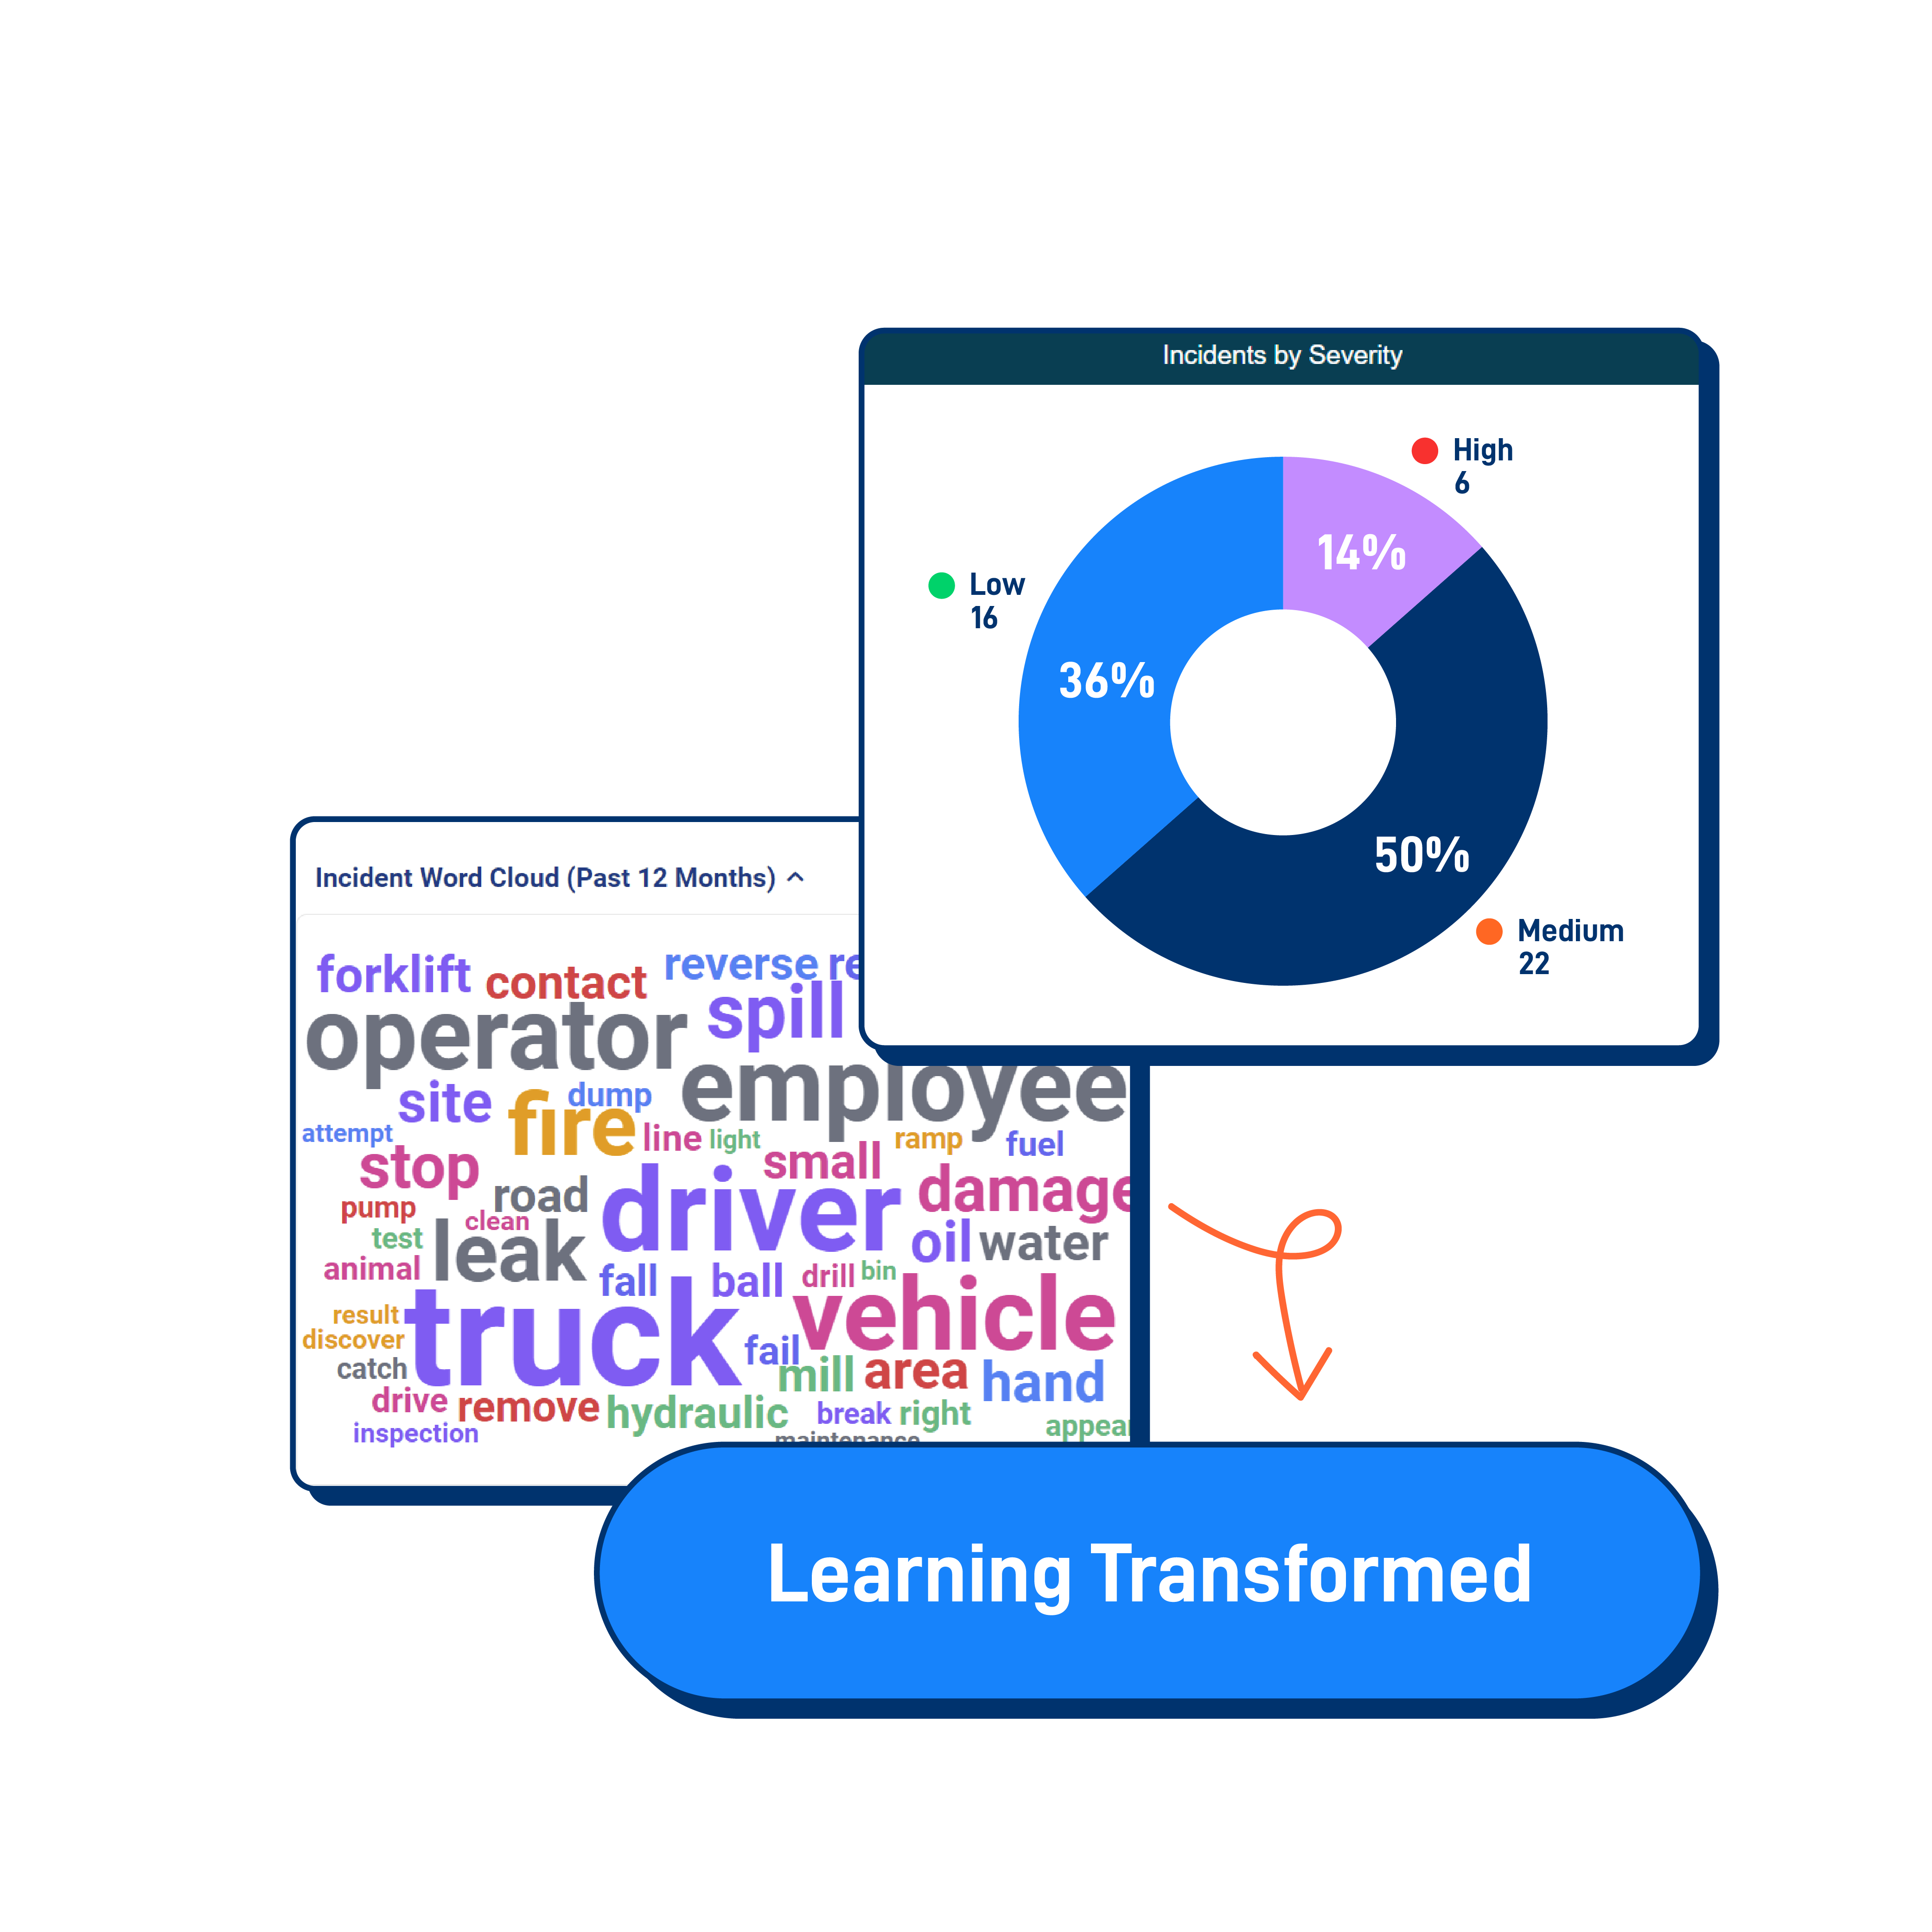
Empower decision makers with data to gain a deep understanding of your EHS&S performance so you can prioritise initiatives and take action.

Better Insights for Smarter Decisions
Time spent collating data into spreadsheets is time that could be spent recognising hazards and implementing controls to reduce risk. Easily get the data you need, from a quick incident summary to deep insights with BI analytics and dashboards. Our tools help you understand your data so you can improve your health, safety, and sustainability processes, all while keeping business running smoothly.
How Can Business Intelligence Help You Analyse Your EHS&S Data?
Get Answers and Insights When You Need Them
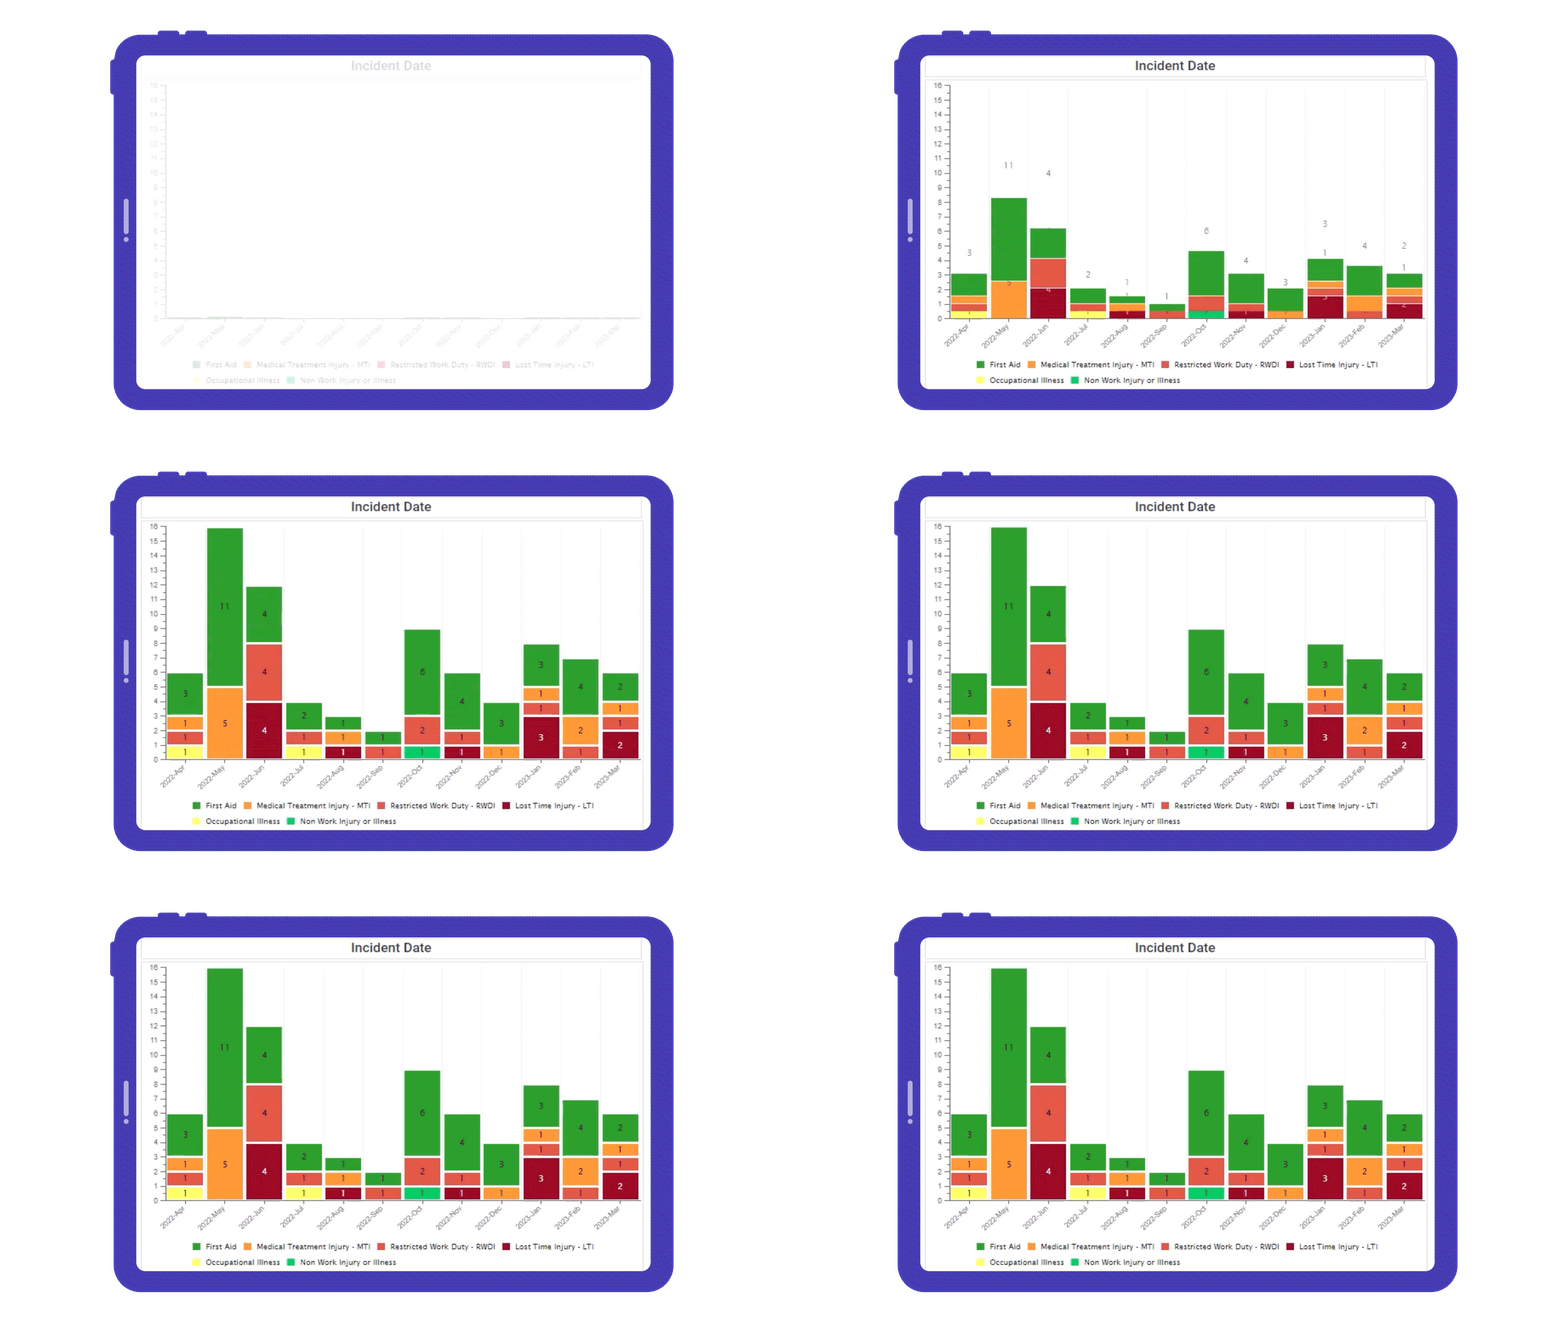
- Filter and drill into your EHS&S data to understand trends.
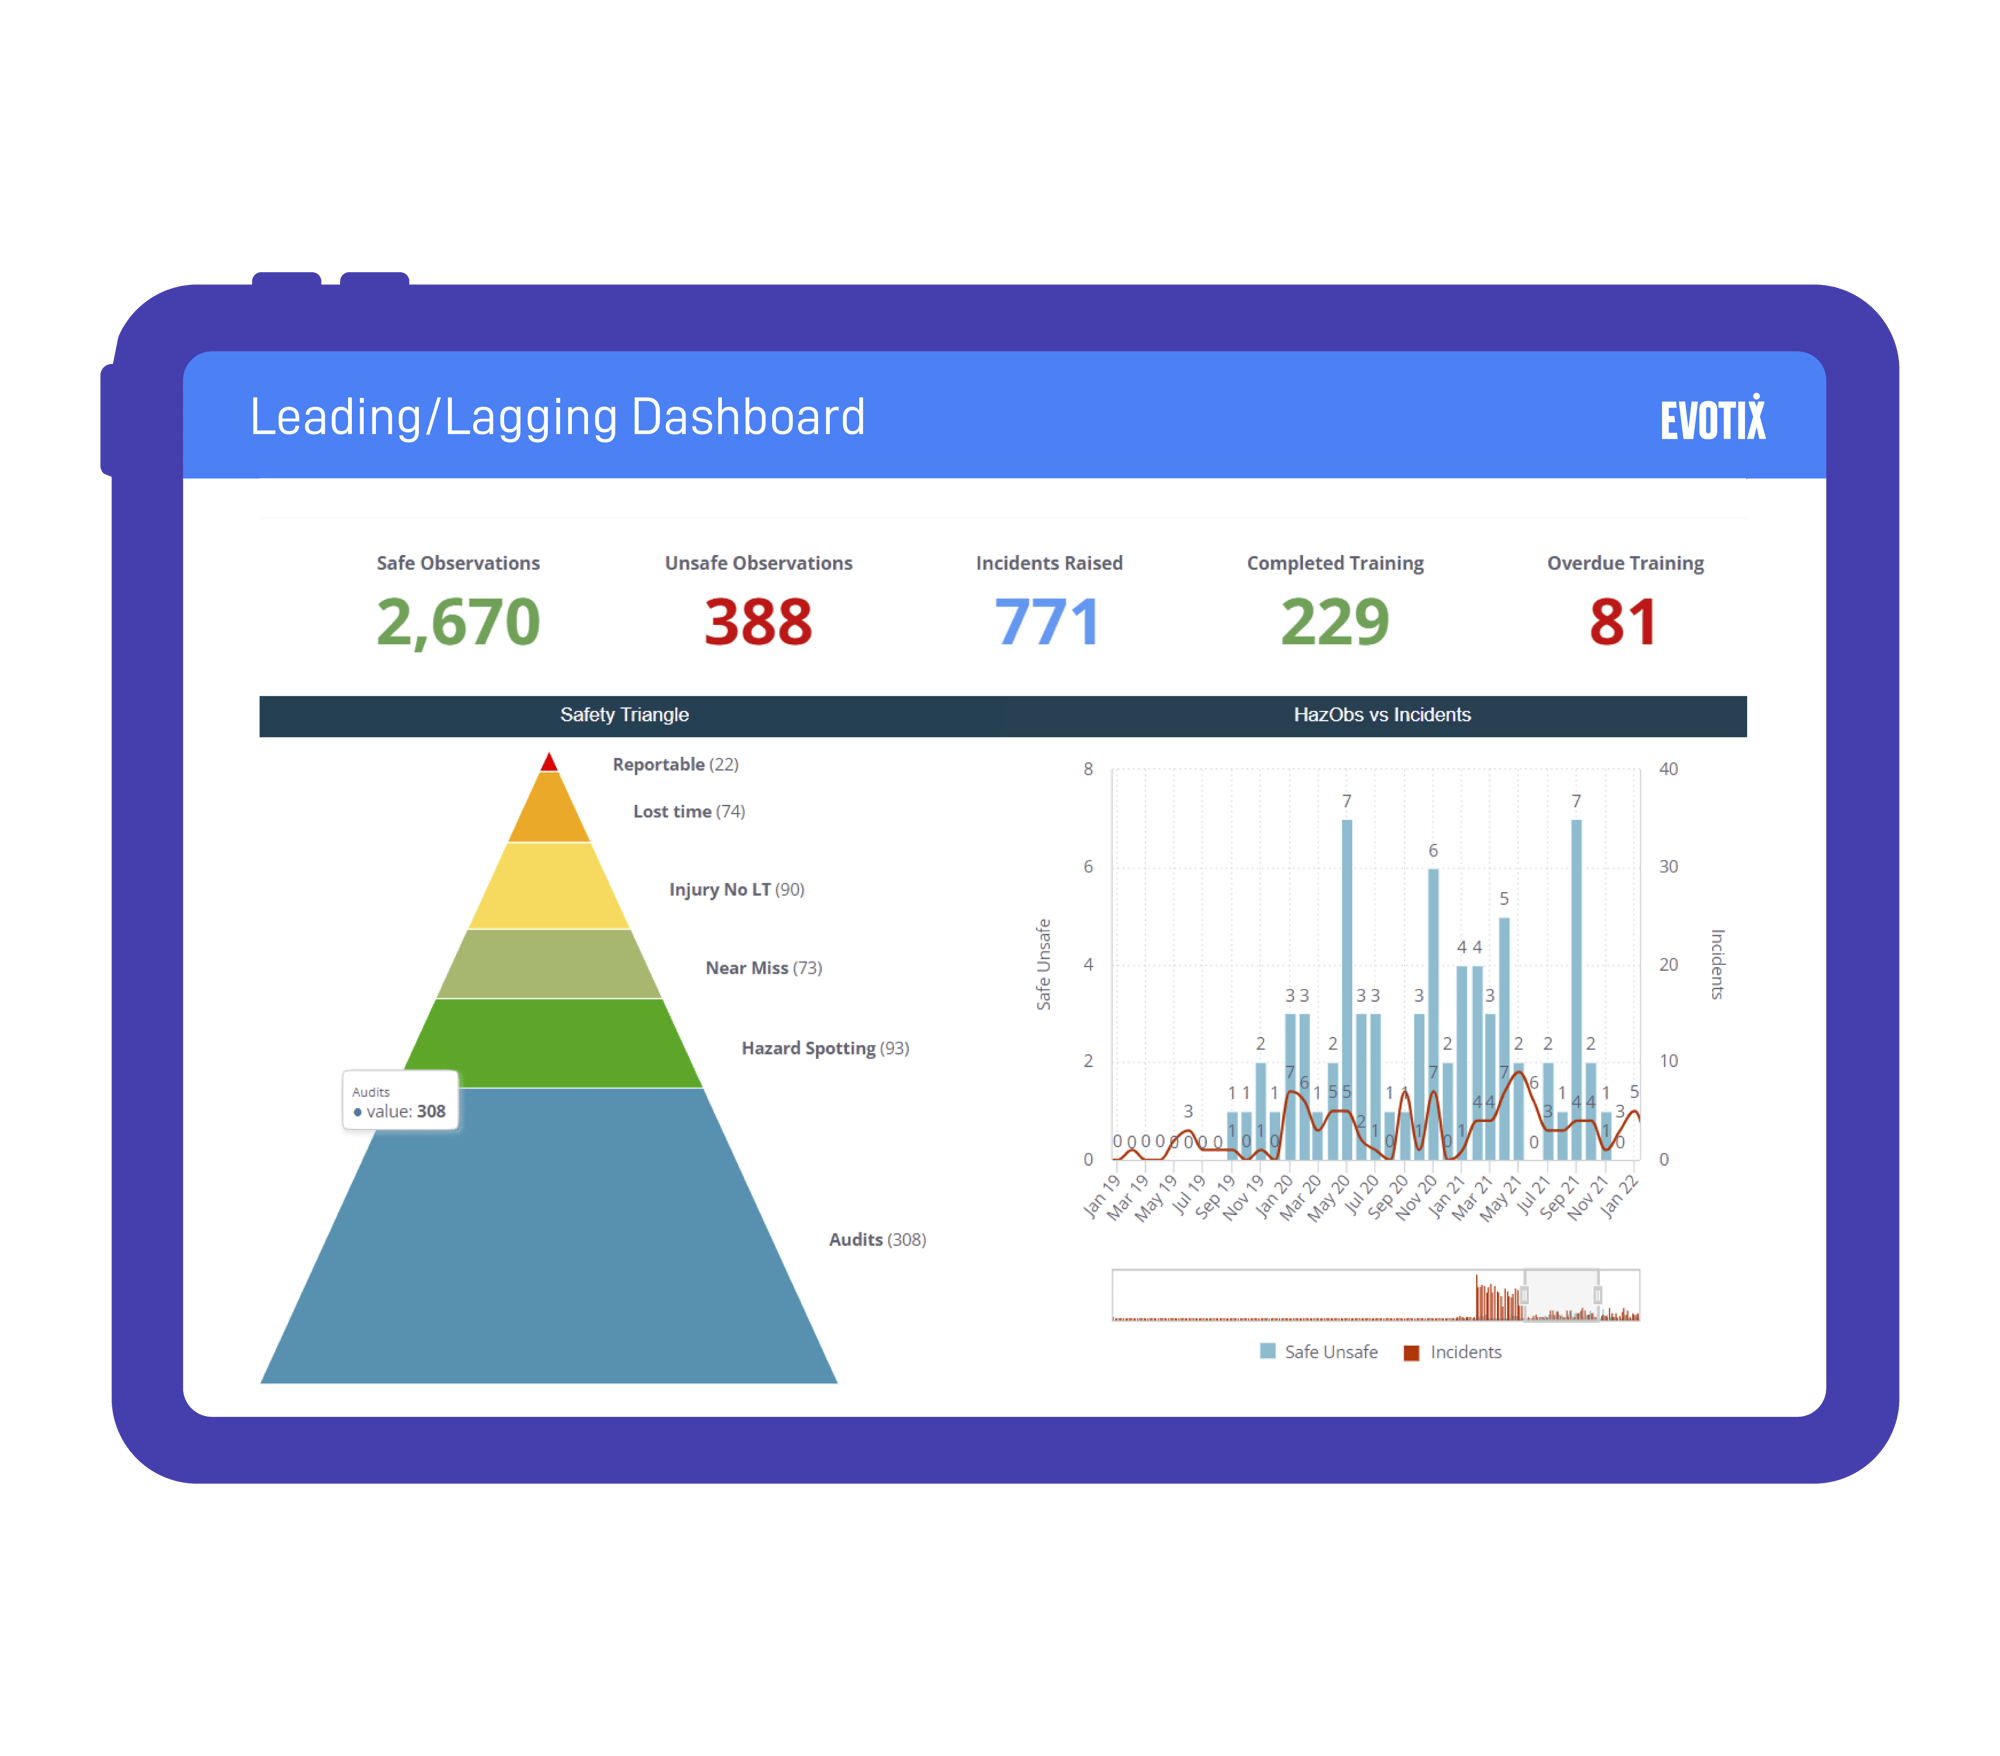
- Track leading indicators and monitor KPIs using pre-configured dashboards.
- Create and export reports for regulatory requirements.
Make Empowered Decisions
- Quickly understand performance, spot concerns, and identify areas that need attention.
- Move from lagging to leading indicators for continuous improvement.
- Share tailored reports to give your team the information they need to make informed decisions.
Learn more on how to automate your EHS&S processes by reading our "5 Things Your Spreadsheets Can't Do" article.
Start Conversations
- Easily distribute visual dashboards with relevant EHS&S data within your organisation.
- Consistently share analytics and insights to make safety & ESG conversations part of daily activities.
- Make EHS&S an integral part of your operations with dashboards built for business leaders.
Drive Insights From Data With These Tools:
- Dashboards: Present data in a visual, user-friendly way with pre-configured dashboards, or tailor your own using 20+ chart types.
- Powerful Analytics: Track leading indicators and monitor KPIs accurately. Drill into and filter data to identify trends, track leading indicators, and monitor KPIs.
- Share Analysis: Easily share charts and dashboards across your organisation. Schedule regular delivery to key stakeholders.
- Regulatory Reporting: Streamline reporting processes for regulatory requirements and send data to regulatory bodies in a timely manner.
- Accessibility: Consistently capture data with mobile-first reporting. Employees can report on any device, anytime, anywhere, increasing visibility across your organisation.
Be the Inspiration for Change


%20Section%203.png?width=2000&name=BI%20(from%20Risk%20Management)%20Section%203.png)